From the Spring 2014 issue of Cornerstone, the Official Journal of The World Coal Industry. Check out the magazine online at www.cornerstonemag.net
By Li Zheng
Professor, State Key Lab of Power Systems, Department of Thermal Engineering, Tsinghua University
Pan Lingying
Ph.D. Candidate, State Key Lab of Power Systems, Department of Thermal Engineering, Tsinghua University
Liu Pei
Associate Professor, State Key Lab of Power Systems, Department of Thermal Engineering, Tsinghua University
Ma Linwei
Associate Professor, State Key Lab of Power Systems, Department of Thermal Engineering, Tsinghua University
China has been experiencing rapid industrialization and urbanization since the 1980s, with an annual gross domestic product (GDP) growth rate of approximately 10.7% from 2003 to 2011. Although the rate of growth has slowed, the general trend of an increasing GDP is projected to continue into the foreseeable future. To support this economic development, a corresponding increase in primary energy consumption is also expected. Coal makes up nearly 70% of China’s total primary energy consumption. Coal production, the vast majority of which is consumed in China, increased rapidly from 1.38 billion tonnes in 2001 to 3.68 billion tonnes in 2013. Although the rate of increase has slowed in recent years, coal will continue to be the principal energy source for China in the long term. However, some sectors in the coal industry are highly water intensive, and water shortages could become a major barrier for further development. Moreover, water and coal resources are unevenly and inversely distributed in China. Coal reserves are mainly located in north China, while water resources are abundant in the south but scarce in the north. Considering these issues, water scarcity could become a constraining factor for the future development of the coal industry in China’s coal-rich regions.

The development and application of water-saving technologies in all sectors of the coal industry could make a dramatic impact.
This article provides a comprehensive analysis of water use in China’s coal supply chain, including coal mining, preparation, transport, conversion, and final disposal. We also illustrate the interaction between the water system and the coal industry and analyze several scenarios for water usage in China’s coal supply chain in 2020 and 2030, based on which several technical and policy suggestions are proposed for water savings.
Water Issues in the Coal Supply Chain
The main stages of the coal supply chain are shown in Figure 1. The supply chain comprises mining, preparation, transport, conversion, and disposal of pollutants, emissions, and waste. In each stage, water is either withdrawn directly from natural water bodies (i.e., surface or underground water) or recycled from other stages and reused. Concerns over water issues in the coal supply chain mainly involve impacts to water use for production and living, water recycling, wastewater treatment, and the local environment.
In 2011, 610.7 billion m3 of water was consumed in China, 23.9% of which was used for industrial purposes.3 The coal industry, including coal mining and preparation, coal-fired power generation, and the coal-to-chemicals industry, is one of the most water-intensive industries.
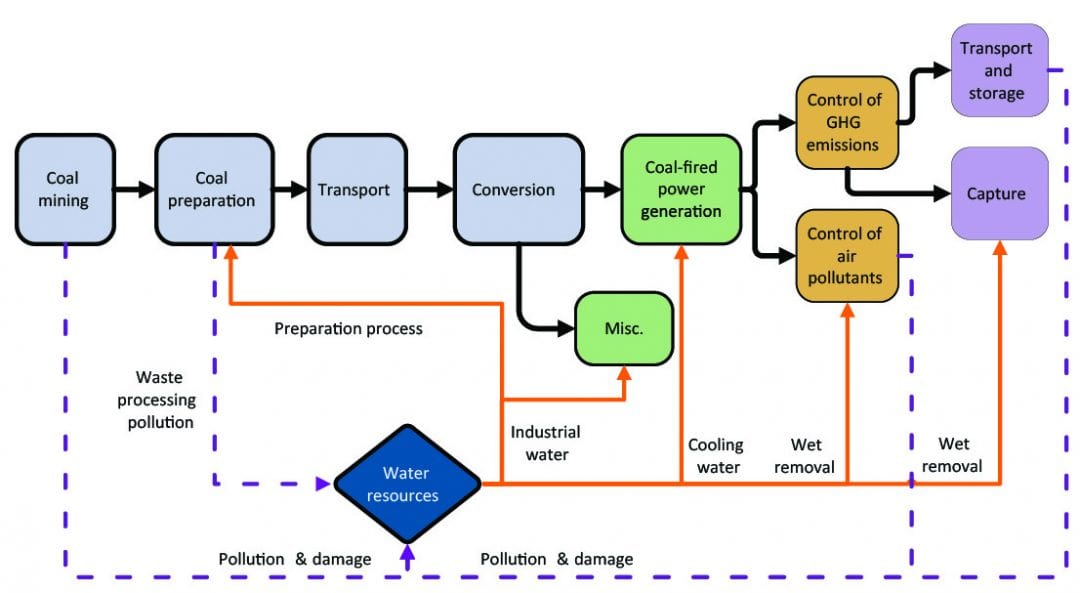
Figure 1: Interactions between the coal supply chain and water resources.
Mining
It is estimated that China has approximately 14,000 coal mines, which produced 3.63 billion tonnes of coal in 2012. Approximately 70% of these mines are located in water-scarce areas and about 40% experience severe water shortage problems. During coal mining, ~0.5 tonnes of water are consumed to produce 1–2 tonnes of coal, while on average four tonnes of pit water are drained. Cumulatively, coal mining produces approximately 3–6 billion tonnes of wastewater per year. Mining activities can also cause damage to water systems, especially underground water. For instance, 1.07 tonnes of underground water reserves are used to produce one tonne of coal in Shanxi Province in China.3
Coal Preparation
In the coal preparation sector, water is mainly consumed for coal-washing purposes, although coal preparation consumes far less water than other areas in the coal industry. In China, 94% of cleaned coal is prepared via wet methods (i.e., coal washing). On average, for one tonne of prepared coal 2.5 tonnes of water is used:4 0.15 tonne is removed with the by-products, 0.05 tonne is consumed in the process and for maintenance purposes,5 and the remainder is recycled in a closed loop. According to data from the China National Coal Association, by 2012 about 56% of coal was washed and about 35% of steam coal was washed. Coal preparation reduces the ash and sulfur content in coal, increasing its quality. In coal- fired power generation, coal consumption is reduced by 2–5 gce/kWh for every 1% decrease in ash content.5
Although wet preparation methods are mature and highly effective, water-related issues are one of the key technical barriers to increasing the coal-washing rate in China. The actual water loss during the preparation process is unacceptable in extremely arid regions, such as northwest China. In addition, China’s abundant young coal readily degrades in water, and is thus not suitable for wet processing. Also, the product of the wet washing process has an external water content of over 12%, which can result in freezing when transported under severely cold conditions.6
Conversion
Coal-fired power generation remains the dominating sector for coal conversion. Most water used in the coal industry is used for coal conversion, specifically for coal-fired power plants, many of which are located in arid regions. According to the China Electricity Council, in 2010 the average water consumption of thermal power plants in China was 2.45 kg/ kWh, most of which were coal-fired plants, while the average water consumption of thermal power in the U.S. in 2005 was 1.78 kg/kWh.7 This disparity is mainly due to the difference in the countries’ respective power generation fleets (i.e., higher ratio of coal- to gas-fired power plants in China compared to the U.S.).8–10 For each coal-fired power plant, most of the water requirements are due to cooling. Dry air cooling, instead of wet cooling systems, can reduce power plant efficiency, but also offers substantial water savings if employed.11 China has made major progress employing dry air cooling. In 2013, there was a total of 150 GW (based on data from the China Electricity Coal Council) of installed thermal power units with dry air cooling, which was 17% of the total thermal power installed capacity. Increased deployment of supercritical power plants, ultra-supercritical power plants, and various water-saving technologies will reduce the average water consumption, which will be more important in areas with water scarcity.
In the coal-to-chemicals industry, approximately 2.5 tonnes of fresh water are consumed to produce one tonne of coke. However, in the coal-to-liquids industry, an indirect coal-to- liquids plant with a capacity of 1.5 million tonnes per year consumes 6–10 tonnes of water to produce one tonne of product, making it an extremely water-intensive industry.
Clearly the efficiency of water utilization by China’s coal industry leaves substantial room for improvement. Potential water savings can be further increased through integrated planning, where the water issues can be considered from a supply- chain-wide viewpoint rather than stage by stage separately.
Scenario Analysis: Water Use in the Coal Supply Chain in 2020 and 2030
In November 2010, the State Council of China released a response to the Comprehensive Plan for National Water Resources (here after referred to simply as the “Water Plan”), which set water use targets for industrial use in China of 127 billion m3 and 120 billion m3 in 2020 and 2030, respectively. According to the Water Plan, any water-intensive industry should not increase its percentage of total industrial water use; this is especially true for applications such as coal-fired power plants that have significant potential for water savings.
Scenario Design
In its World Energy Outlook (WEO) 2010, the International Energy Agency (IEA) provided three scenarios to analyze global and regional energy trends in 2020 and 2030.12 For our research the coal demand data in the WEO Current Policies Scenario was taken as a base case; the data in the New Policies Scenario was used to estimate the impacts of policy on future trends. In addition, based on the present status of technology development, the effects of technology on water use were applied in the scenarios. Building on these factors, we proposed the following four scenarios:
- Scenario 1 (S1) serves as a baseline, without any consideration given to policies changes and/or technology improvements.
- Scenario 2 (S2) considers the impacts of technology improvements under current policies.
- Scenario 3 (S3) considers the impacts of policy changes without technology improvements.
- Scenario 4 (S4) combines the policy changes and technical progress to account for the synergistic impacts.
Note that the 2010 State Council response to the Water Plan used 2008 as the base case year; for this reason, 2008 was also used as the base case year for these analyses. In this study water use does not include water withdrawal for once- through cooling systems in the coal-fired power industry. While the water withdrawal can be large in such systems, very little is consumed and the vast majority is returned to the original water source.
Results and Discussion
The results of the scenario analysis are presented in Figure 2, which illustrates water use in the coal supply chain from 2008 to 2030, as well as the estimated total industrial water use targets according to the Water Plan. In Scenario 1 and Scenario 3, where technological improvements are not considered, water use in the coal supply chain continues to increase. In Scenarios 2 and 4, water use in the coal supply chain decreases slightly before 2020 and declines appreciably after that.
The results from Scenario 1 indicate that if no water-saving policies or technological improvements are adopted water use in the coal supply chain will continue to increase dramatically; by 2030, water use is projected to be more than twice as much as in 2008.
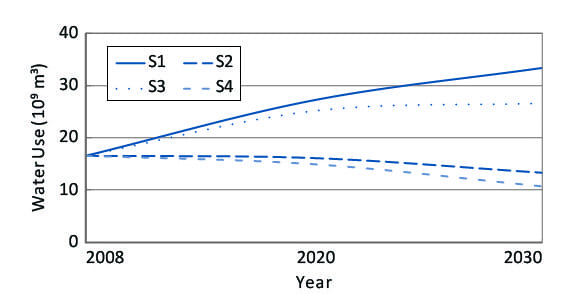
Figure 2: Water use trends of the coal supply chain in China, 2008-2030.
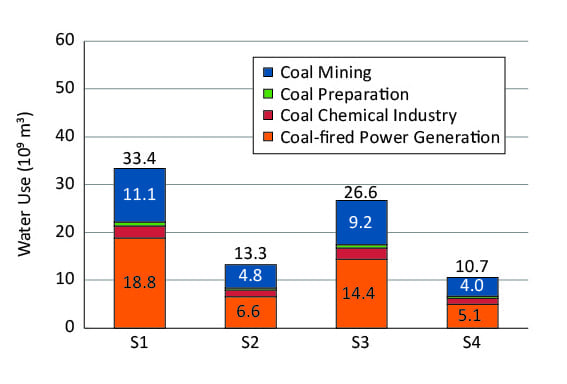
Figure 3: Water use by sector in the coal supply chain in China, 2030.
The results from Scenario 2 indicate that, with the current policies, developing and deploying water-saving technologies can effectively control and even reduce water use in the coal supply chain to about 11% of the total 2030 industrial water use target. In 2020, this ratio is only slightly higher than in 2008, but between now and 2020 there is also expected be growth in other water-intensive industries (e.g., paper making, metallurgy, and textile industries). Therefore, we predict that actual industrial water use will exceed the targets around 2020 if only technology improvements are applied. New effective policies are necessary to ensure the water use target is achieved.
In the Scenario 3 analysis the impact of policy changes were taken into account. Water use in this scenario does not increase noticeably from 2020 to 2030, but water use levels are higher than those in 2008. The results indicate that the potential capability of policy changes alone to reduce water use in the coal supply chain is rather limited. To achieve necessary water savings, the government should implement stricter policies and develop relevant water-saving technologies.
Comparing the results of Scenario 2 and Scenario 3, technological improvements have more substantial effect than policy changes. We suggest more rapid progress in technological improvement is critical to ensuring that the 2020 and 2030 industrial water use targets can be achieved.
The results of Scenario 4 demonstrate the integrated influence of policies and technical progress on water use reduction. In 2030, water use in the coal supply chain would be 10.7 billion m3, 9% of the industrial water use target. However, around 2020, we identified the same problem with that described in Scenario 2. Under Scenario 4, water use in the coal supply chain in 2020 was projected to be 14.9 billion m3, ~12% of the industrial water use target. In this case, actual industrial water use is likely to exceed the water-saving target for the same reasons discussed above. However, it is clear that both stricter policies and faster technological improvements must contribute to further reductions in water use.
Figure 3 illustrates water use by sector in the coal supply chain in 2030. Water use in coal-fired power generation makes up the largest share, and therefore offers the greatest potential for water savings. In 2008, water use in coal-fired power generation was 7.86 billion m3, with electricity generation of 2759 TWh. In Scenario 2, coal-fired power generation is 6605 TWh in 2030, an increase of 140% compared to 2008, while total coal industry water use is reduced by 20%. In Scenario 4, coal-fired power generation is 5060 TWh in 2030, an increase of 83%, while total coal industry water use is reduced by 36% relative to 2008 actual levels. In general, since major water use reduction is most likely to occur in coal-fired power generation, we conclude that promoting strict policies and technical progress in the coal-fired power industry would be the most effective way to reduce water use in the coal industry in China.
Although the absolute water savings in coal mining, coal preparation, and coal-to-chemicals industry are relatively small compared with that for coal-fired power generation, there are significant differences between the four scenarios when examining the water use reduction rate in each sector. For coal mining, water use is 11.1 billion m3 in Scenario 1. In Scenario 2 the coal mining water use is reduced by 57% compared to Scenario 1. In Scenario 3 water use is reduced by 17%. In Scenario 4 projected coal mining water use is reduced by 64%. For the coal-to-chemicals industry, the results are similar. These outcomes indicate that, with technology improvements and the implementation of new policies, significant reductions in water use could be achieved, providing economic benefits (e.g., reduced water cost) as well as environmental benefits (e.g., less wastewater drainage).
Practical Pathways for Water Savings
As discussed above, the water issues in the coal supply chain in China could severely constrain the further development of China’s coal industry. Therefore, we suggest the following pathways for water savings in each stage of a coal supply chain.
In coal mining, large quantities of the wastewater are discharged currently. Thus, the largest potential of water savings in the coal mining stage is to recycle the mining wastewater for other purposes according to the water quality.
As coal preparation contributes to higher efficiency in coal- fired power generation, great water-saving benefits can be obtained by increasing the ratio of washed steam coal in China.
The scenario analysis results indicate that coal-fired power generation accounts for the largest share of water use in the coal supply chain in China, and has the greatest potential for water savings. For a circulating cooling system, the optimum concentration ratio (i.e., the ratio of solids in the water being added to the system versus the solids in the water being removed from the system, which is important to limit build-up of solids in the cooling tower) is 4–5, whereas in China 80% of the coal-fired units are operating with a concentration ratio lower than 3.13 It is effective to increase the concentration ratio to reduce water consumption. Another practical method is to control water loss in cooling towers by reducing the quantity of circulating water. In addition, recycling wastewater as well as utilizing air-cooling units in arid areas and seawater cooling in coastal areas will also reduce total water consumption.
In the coal-to-chemicals industry, water use is likely to increase quickly as many new plants are either under construction or planned. As projects are developed, building in higher plant efficiency and wastewater treatment could contribute to water savings.
Conclusions
Water issues are of great importance to China’s coal supply chain. The results of our analysis have indicated that, by 2030, coal- fired power generation will continue to account for the greatest fraction of water use in the coal supply chain. Both technology improvements and stricter policies are necessary to control the overall water use, but technology improvement is likely to be more effective than policies in the near-term future for reductions in water use. In terms of water savings, various options are available for each coal industry sector. Recycling wastewater, increasing the fraction of washed coal, optimizing the circulating cooling system and ash handling systems for coal-fired power plants, and improving plant efficiencies are considered practical and comparatively effective to improve water savings. With these measures, the targets for water consumption set by the State Council may be achieved to allow the sustainable development of China’s coal industry.
Acknowledgements
The authors gratefully acknowledge financial support from the National Natural Science Foundation (project No. 51106080) as well as financial support from BP under the scope of the Energy Sustainability Challenge project and the Phase II Collaboration between BP and Tsinghua University. Personal communication with Dr. Jennifer Turner from the China Environment Forum in Washington, DC, is also gratefully acknowledged.
REFERENCES
- National Bureau of Statistics of China (NBSC). (2012). China statistical yearook 2012. Beijing: China Statistics Press.
- NBSC. (2013). National data. National Bureau of Statistics of China. Available at: data.stats.gov.cn/workspace/index;jsessionid=E705BC8540034123537058E4C125A36A?m=hgnd
- Wang, Q. (2010). Evaluation on influences of coal mining for water resources and control measures. Shanxi Hydro Technics, 175, 14–16.
- Zhong, Y. (2001). Zero draining of waste water in coal preparation industry. Industrial Water & Wastewater, 32, 43–44.
- Tao, H. (2009). China coal preparation technology as viewed from the energy conservation and drainage reduction. Coal Technology, 28, 111–112.
- Chen, Q., & Luo, Z. (2003). Assessment of dry methods for coal preparation (in Chinese). Coal Preparation Technology, 6, 34–40.
- Jiang, Z., & Han, H. (2008). Water resources utilization situation and countermeasures of thermal power unit. Huadian Technology, 30, 1–5.
- U.S. Energy Information Administration (EIA). (2011). Existing capacity by energy source 2009 (Table 1.2). In: Electric power annual 2009. pbadupws.nrc.gov/docs/ML1104/ML110410547.pdf
- Mielke, E., Anadon, L.D., & Narayanamurti, V. (2010). Water consumption of energy resource extraction, processing, and conversion. Energy Technology Innovation Policy Discussion Paper Series. Cambridge, MA: Harvard Kennedy School. belfercenter. ksg.harvard.edu/files/ETIP-DP-2010-15-final-4.pdf
- U.S. Energy Information Administration, (2009). Electric Power Annual – Existing Capacity by Energy Source (2009). www.eia.gov/electricity/annual/
- Wang, P. (2009). The 4 development stages of domestic air cooling thermal power units and the total loading capacity (in Chinese). Power Equipment, 23, 69–72.
- IEA. (2010). World energy outlook 2010. OECD/IEA. www.worldenergyoutlook.org/media/weo2010.pdf
- Kang, L., & Wang, J. (2008). Discussion on water-saving and consumption reduction measures in thermal power plants. Electric Power Environmental Protection, 24, 40–43.
The first author can be reached at [email protected]
The content in Cornerstone does not necessarily reflect the views of the World Coal Association or its members, nor does its reproduction on this site necessarily reflect the views of the MaterialsViews editorial team.