Alzheimer’s disease (AD) is the most common form of age-related dementia. It is pathologically characterized by the deposition of β-amyloid (Aβ) peptides and the development of neurofibrillary tangles in the brain. In a healthy brain, the blood–brain barrier (BBB) selectively prevents harmful materials in the blood from entering and regulates the transport and clearance of brain Aβ.
Research has shown that the BBB is impaired in AD patients and those with mild cognitive impairment, making BBB dysfunction a key factor in the development of AD. Therefore, there is a great deal of interest in developing standardized cell-based models that are comparable to the alterations in the BBB observed in AD. These models would facilitate the study of the function of the BBB in AD and the mechanisms by which BBB impairment affects AD pathogenesis. They would also provide valuable drug screening platforms for BBB improvement.
Currently, cell culture models to study BBB dysfunction use brain endothelial cells (bECs) on transwell inserts. These BBB cells are incubated with high concentrations of synthesized Aβ peptides for short periods of time. However, these models do not contain all components of the AD BBB, such as AD neurons, and do not reproduce the gradual accumulation of soluble Aβ peptides in the extracellular matrix (ECM) and their transport through the local microenvironment. Therefore, the current models are unable to replicate all the critical features of AD.
In a study recently published in Advanced Science, researchers from MIT, Harvard Medical School, the Korea Basic Science Institute, the University of Science and Technology, Korea University, and SMART have successfully developed a more physiologically relevant 3D human neural cell culture model of AD. The model is composed of a bEC barrier in a microfluidics platform that can control the 3D cellular and non-cellular microenvironments. The platform replicates the cerebral–vascular interface by reconstructing a tube-shaped bEC barrier with a BBB-like phenotype. This barrier is integrated into a 3D culture system. Several vascular alterations, which are observed in AD patients, are simulated by the model, including increased BBB permeability with decreased expression of tight junction proteins, increased levels of matrix-metalloproteinase-2 and reactive oxygen species, and aggregation of Aβ on the abluminal side of the BBB endothelium.
As a proof of concept, thrombin, a bloodborne toxic enzyme, was introduced within the endothelialized channel. Thrombin was able to pass the leaky BBB and exacerbate neuronal loss. Conversely, the process was prevented by increasing BBB permeability using pharmacological interventions.
Although the model is not yet capable of reconstituting the BBB vasculature to its full complexity, the authors are currently developing a model with a 3D brain microvascular system, which constitutes a functional barrier, incorporating pericytes and astrocytes—which play roles in BBB maintenance and function—to not only study changes in the vascular endothelium itself, but also the pathological changes in these other neural cells and their effect on BBB dysfunction.
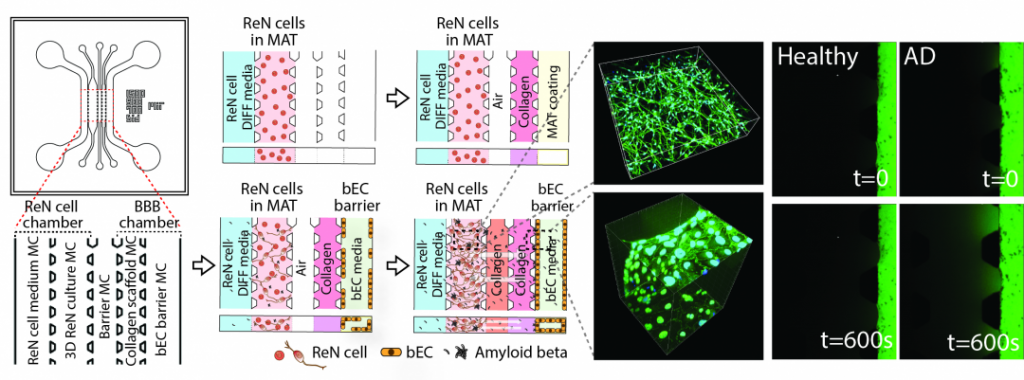
(Left) The model is composed of a human neural progenitor cell line (ReN)/AD cells and BBB chambers with an intervening barrier microchannel (MC). The ReN cell chamber is composed of a ReN cell medium MC and 3D ReN culture MC, and the BBB chamber is composed of a collagen scaffold MC and bEC barrier MC. Numbers (mm) indicate the dimension of the microfluidic model. (Middle-left) Sequential experimental protocol for WT/AD model development. (Middle-right) 3D-differentiated GFP labeled ReN cells in the 3D AD culture MC. Right) Permeability of the bEC barrier in the WT/AD model measured by introducing bEC medium supplemented with 10 × 10−6 M dextran (40 kDa (FITC)) into the bEC barrier MC and monitoring fluorescence every 5 min after flow stabilization. The images were recorded initially (top) and at 600 s (bottom) after adding the dextran.