Image credit: Simone Hutsch on Unsplash
If we are to ameliorate climate change and control global warming to the Paris Agreement target, IPCC analyses indicate we will need to capture CO2 from point sources or ambient air and sequester it or convert it into sustainable chemicals and fuels. Given the plethora of capture and use possibilities, a number of interdependent technical, economic, environmental, societal and political challenges and questions need to be addressed to facilitate choices on the most effective strategy to achieve the greatest reduction in greenhouse gas emissions.
These questions include: What is the CO2 footprint of a process from cradle-to-grave? How much CO2 feedstock needs to be captured to satisfy the demand for chemicals and fuels? What is the energy demand of the CO2 capture and utilization processes? How do these scenarios compare for the case of today’s non-renewable versus a future renewable energy economy for the major producers of CO2 emissions?
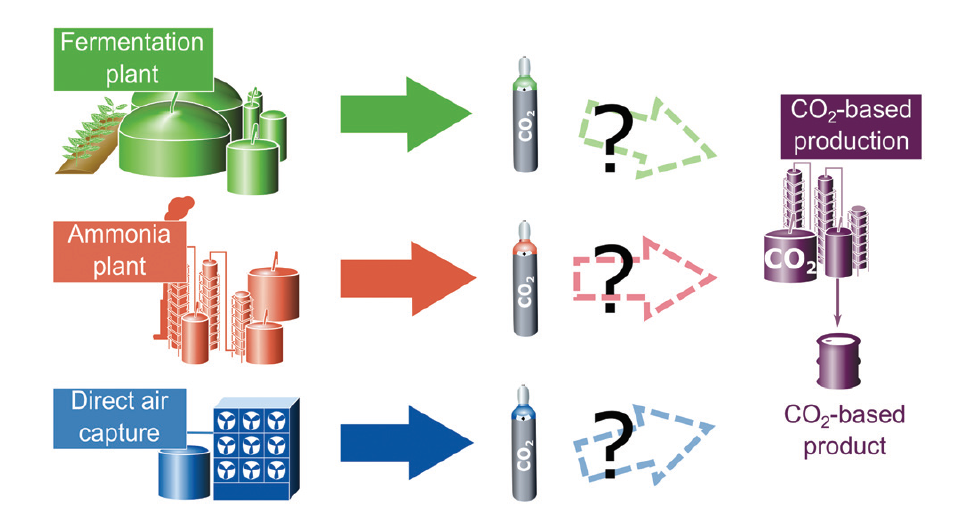
This is a multifunctional and multidimensional problem where optimal decisions for dealing with the deleterious effects of greenhouse gas–driven climate change require the use of a whole-systems life cycle analysis (LCA). The complexity of undertaking this kind of LCA can be appreciated by inspection of the above figure, which illustrates a situation in which CO2 emissions are captured from point source fermentation and ammonia plants, as well as a direct air capture plant, and utilized to make chemicals and fuels.
Rising to this challenge, a recent system-wide study of CO2 emission, capture, and utilization processes and technologies has quantitatively assessed the product-specific energy, economic, and environmental impacts for the case of Europe. The results of this study are conveniently encapsulated in the scheme in the figure, which shows the relationship between the carbon footprint of captured CO2 and the supply of CO2 feedstock for major CO2 emitting industries in today’s economy versus an envisioned low carbon economy. The lower panel also shows the projected demand for CO2 feedstock for chemicals and fuels production in the low carbon economy.
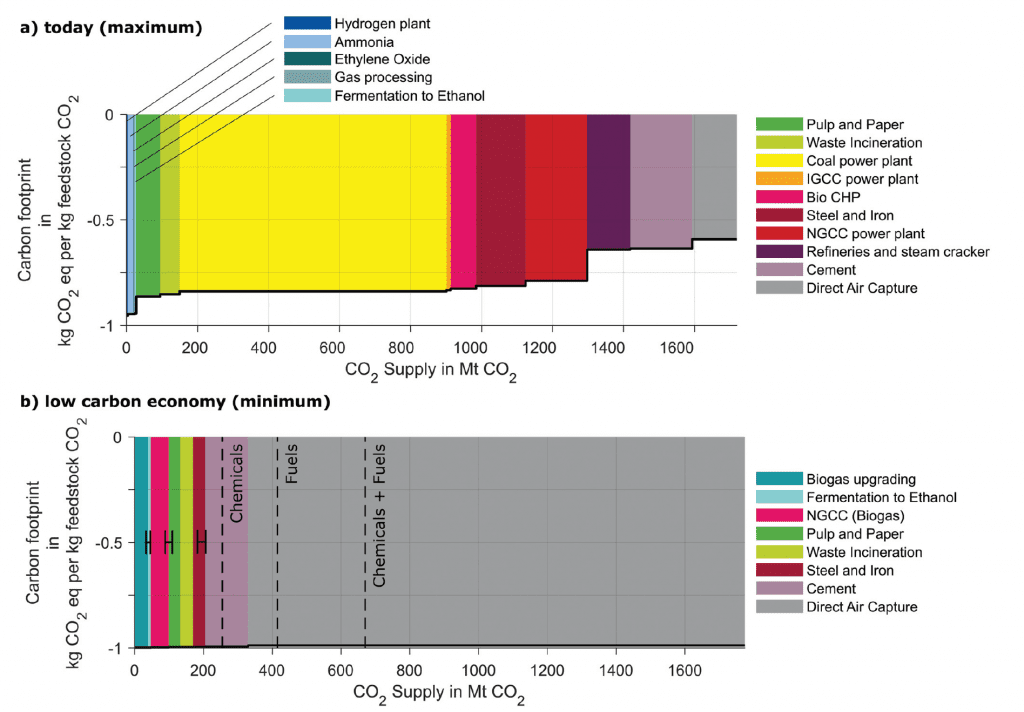
Both panels show the potential reduction in cradle-to-grave CO2 emissions by source. Capture and use have the potential to reduce some, but not all, of the emissions, so they never reach the maximum of minus 1 kg CO2 equivalent/1 kg CO2 feedstock. Since capture and use requires energy, the reductions are much larger for the low carbon scenario where the energy is supplied entirely by renewables.
In today’s economy (panel a) the reductions differ by source due to the CO2 concentration and the energy needed to purify the captured CO2. The LCA finds that the potential reductions vary by source from highest to lowest as follows:
- -0.95 kg CO2 eq. per kg feedstock CO2 for hydrogen, ammonia, ethylene oxide production, natural gas processing, and fermentation to ethanol
- -0.78 to -0.88 kg CO2 eq. per kg feedstock CO2 for pulp and paper mills, waste incineration plants, coal and integrated gasification combined cycle plants, biogas power plants, steel, and iron mills and natural gas combined power plants
- -0.63 to -0.64 kg CO2 eq. per kg feedstock CO2 for refineries, steam crackers and cement plants
- -0.592 kg CO2 eq. per kg feedstock CO2 for the direct air capture process.
These performance metrics allow informed technical, economic, and environmental decisions to be made on the choice of an industry or process to serve as a source CO2 with an associated CO2 footprint. A case in point from this LCA would be to preferentially select an ammonia plant over direct air capture as a source of CO2.
Europe’s current economy has the potential to supply approximately 1550 Mt of CO2 feedstock from industrial facilities with additional supply from direct air capture (panel a). The low carbon economy scenario assumes that all currently envisioned technologies for carbon reduction are implemented to the maximum extent. That reduces the potential supply of CO2 feedstock from industrial facilities by about 80% to 330 Mt (panel b).
The CO2 feedstock demand in the low carbon scenario is about 670 Mt, 255 Mt for chemical feedstock and 415 Mt fuel feedstock (dashed vertical lines in panel b). Aircraft and heavy duty transport use synthetic liquid fuels in this scenario. To meet the feedstock demand, just over half of the supply will need to be produced by direct air capture. Currently this is the least effective technology at -0.592 kg CO2 eq per kg feedstock, but that rises to -0.98 kg CO2 eq per kg feedstock when all of the energy is renewable. Due to the higher CO2 concentrations, capture from industrial sources remains less costly than direct air capture.
The authors estimate that production of 670 Mt of CO2 feedstock will require 1053 TWh of renewable electricity. This is approximately a 40% increase from Europe’s current electricity supply of about 2750 TWh and a much larger expansion of its current renewable electricity output. The intermittent nature of renewable generation means energy storage also would need to be increased significantly. The captured CO2, chemicals and synthetic fuel could serve as a forms of energy storage.
Although illustrative, the analysis provides two important insights. First, the inventory of industrial sources for CO2 capture will shrink as mitigation measures are implemented, leaving direct air capture as the dominant option. Second, a major increase in renewable electricity capacity will be needed. Increased energy efficiency and expansion of energy storage will be critical to meeting the demand for renewable electricity.
Written by: Geoffery Ozin
Solar Fuels Group, University of Toronto Ontario, Canada, Email: [email protected], Web sites: www.nanowizard.info, www.solarfuels.utoronto.ca, www.artnanoinnovations.com.
This article was kindly checked by Dr. Erik Haites, Margaree Consultants, Toronto
Reference: Müller, Leonard, et al. The carbon footprint of the carbon feedstock CO2, Energy & Environmental Science (2020), DOI: 10.1039/d0ee01530j