 The polymer microstructure has a large impact on a material’s properties, in particular – the frequency of long-chain branches affects the rheological properties. The most prominent example of a highly branched polymer is low density polyethylene (LDPE). Its outstanding properties are determined by the level of branching. One important measure for quantifying the branching density is the change in the radius of gyration (rg) with molar mass, which can be determined experimentally. In order to optimize the amount and type of branches it is important to carry out detailed kinetic simulations of polymerization processes.
The comparison of polymer architectures derived from simulations with experimental rg data may be performed following the approach of Zimm and Stockmayer, if the polymer investigated is already well-characterized, as for example in the case of polyethylene. However, the parameters are not available for most other polymers.
In their recent work, Sabine Beuermann and co-workers (Clausthal University of Technology) have introduced a new pragmatic approach, which allows for the calculation of rg based on a random walk method being sensitive towards long-chain branches. The quantities required for this approach are easily derived from experimental data from size exclusion chromatography with on-line viscosimetry or MALLS detection.
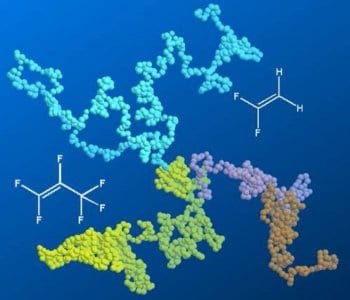
The procedure described is applied to copolymers of vinylidene fluoride (VDF) and hexafluoropropene (HFP). Firstly, the parametrization was carried out using viscosity data of linear copolymers with widely varying VDF content. Then, these parameters were used for the simulation of branched copolymer molecule conformations giving access to rg. The random walk may supplement a kinetic Monte Carlo simulation, where molecules containing short-chain branches and long-chain branches are generated. Using both methods, a complete picture of the simulation results can be gained on multiple scales, from molar mass distribution to compositions as a function of molar mass and finally conformation plots.