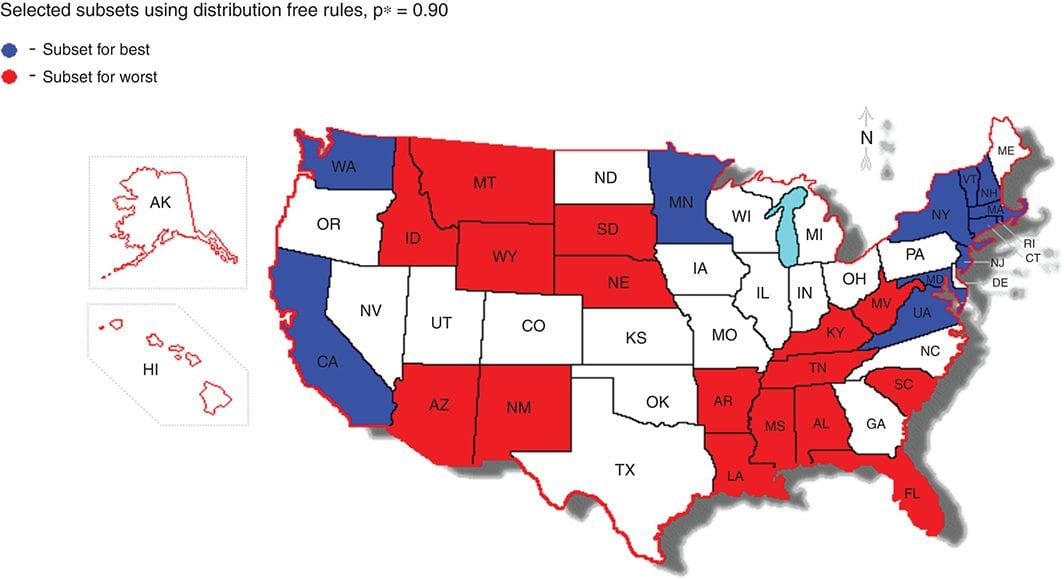
While motor vehicle traffic fatality rates (MVTFR) in the United States have decreased from 1.73 to 1.13 fatalities per 100 million vehicular miles of travel from 1994-2012, such improvement has not been uniform across every state. A study examining the years from 1982-2002 focused on ranking these fatality rates from best to worst. In these scenarios, “best” is the lowest likelihood of fatalities and “worst” the highest. States with the best rates mainly included East Coast states as well as selected North Central states and the state of Washington. The states with the worst fatality rates consisted primarily of Southeastern states, as well as several states in the Northwest and Southwest.
In the “Applications of subset selection procedures and Bayesian ranking methods in analysis of traffic fatality data” recently published in WIREs Computational Statistics, Gary C. McDonald from Oakland University applies nonparametric and parametric subset selection procedures to build upon the previous study, analyzing MVTFRE data for the years 1994 to 2012. McDonald applies a new Bayesian approach to the ranking of states. In this method, a probability distribution is derived over all possible permutations of the population means.
The statistical model for the data is a two-way block design with years forming the blocks and states forming the treatments. The variability in the data attributable to common yearly changes can be eliminated by better addressing the primary questions of concern. With this approach, it is essential that the statistical model have no interaction between states and years.
In McDonald’s research based on nonparametric subset selection rules and a 90 percent confidence, the “best” subset includes states from the Northeast along with MN, WA, VA, and CA; and the “worst” subset included primarily Southeastern states and some states in the Northwest and Southwest. A parametric subset selection procedure, with the same 90 percent confidence level, is also applied to the data. The subsequent “best” subset contains only the state of MA, and the “worst” subset contains the three states SC, MT, and MS. The nonparametric procedures benefit from requiring relatively few assumptions to justify the inferences. In contrast to the nonparametric methods, the parametric approach utilizes the magnitudes of the data rather than the ranks. Thus, in this application, the normal means parametric approach results in a dramatic reduction in the number of states chosen for the selected subsets.


